Yellow flowers in bloom in a garden bed with red stone edging, in front of a brick building with white trim and large windows, under a partly cloudy sky. Trees and a paved path are also visible.

CVRTI Timeline

1997 Three-Dimensional Electrical Activation of the Ventricles
Thermal images showing heat distribution on human torsos, viewed from the front and back. Three plates compare temperature changes before and after treatments at different times and sites, with color scales indicating heat intensity.

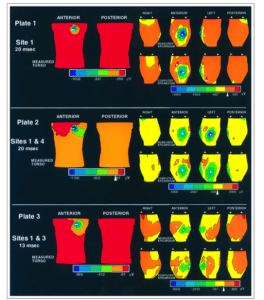
Drs. Ershler, Lux, and Taccardi demonstrate electrical recordings from the body surface can reliably detect three-dimensional electrical activation of the ventricles. Oster HS, Taccardi B, Lux RL, Ershler PR, Rudy…
Read More

2020 The Role of Non-Glycolytic Glucose Metabolism in Myocardial Recovery
Line graph showing % mitochondria in different size ranges (AU) for five groups: Donor, Pre-NR, Pre-R, Post-NR, and Post-R. Donor peaks at 17-28 AU; all groups show significant differences at various ranges. Error bars are present.

Drs. Chaudhuri, Drakos, and Selzman demonstrate heart failure patients who successfully respond to mechanical unloading have major alterations in cardiac metabolism that may facilitate their recovery. Badolia R, Ramadurai DKA,…
Read More

2018 Mitochondrial Metabolism Can Be Regulated By Smyd1
Diagram of a mitochondrion showing fatty acid and pyruvate transport. Fatty acids use CPT1/2 and carnitine to become Acyl-CoA, while pyruvate enters via MPC. Both produce Acetyl-CoA, feeding into the TCA cycle and ETC.

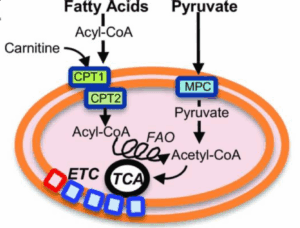
Drs. Franklin, Warren, and Zaitsev demonstrate mitochondrial metabolism can be regulated by Smyd1, an important modulator of gene expression in the heart. Warren J, Tracy CM, Miller MR, Makaju A,…
Read More

2019 Director Shaw
robin shaw small

Robin Shaw, MD, PhD is appointed Director.

2017 Predicting Edema and Chronic Lesion Size
A: MRI and heart dissection highlight acute (blue) and chronic (red) damage. B: Close-ups of each region. C: Microscopic view of acute heart tissue. D: Microscopic view of chronic heart tissue. Blue stains indicate tissue changes.

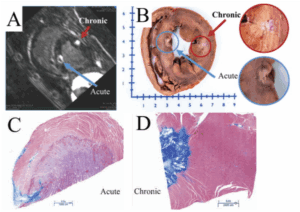
Drs. Dosdall, MacLeod, and Ranjan demonstrate late gadolinium enhancement-MRI done acutely after myocardial ablation can quantify edema in the tissue and correlate the acute MRI findings with chronic lesion formation.…
Read More

2017 End-Stage Human Heart Failure Induces Development of Sheet-Like Invaginations of the Cell Membrane
Black and white microscopic images show tissue structure comparisons. Enlarged insets highlight distinct morphological details, with blue boxes and arrows indicating areas of interest for closer examination.

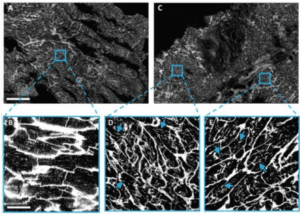
Drs. Drakos, Sachse, Selzman, and Tristani-Firouzi demonstrate that end-stage human heart failure induces development of sheet-like invaginations of the cell membrane that may constitute a precondition and predictor for functional…
Read More

2011 First Intracellular and Extracellular pH on Calcium Handling in Heart Cells
Diagram showing mechanisms of ion transport across a cell membrane (A) and graphs (B, C) comparing effects of extracellular and intracellular acidosis on various electrophysiological measurements, with control and acidosis conditions shown.

The first comprehensive evaluation of selective actions of intracellular and extracellular pH on calcium handling in heart cells by Dr. Spitzer. Saegusa, N., Moorhouse, E., Vaughan-Jones, R.D., Spitzer KW. Influence…
Read More

2014 Dr. Sanguinetti Describes the Molecular Basis of Gating in a Key Potassium Channel
Diagram (A) shows constructs of wild-type (WT) and mutant (mut) hERG1; (B) is a molecular model of a helix, highlighting residues G628, S631, S620, T618, and M654 with labels and space-filling representations.

Dr. Sanguinetti describes the molecular basis of gating in a key potassium channel involved in cardiac action potential repolarization. Wu W, Gardner A, Sanguinetti MC. Cooperative Subunit Interactions Mediate Fast…
Read More

2003 Dr. Sheets Defines the Molecular Basis of Lidocaine’s Effect on Sodium Channel Gating
A: Traces showing electrical recordings under control and lidocaine conditions. B & C: Plots with open and filled circles, showing current-voltage relationships for DI-R1C and DII-R1Q, with sigmoidal curves and a horizontal dashed line.

Dr. Sheets defines the molecular basis of lidocaine’s effect on sodium channel gating. Sheets MF and Hanck DA. Molecular action of lidocaine on the voltage sensors of sodium channels. J.…
Read More

2003 Director Spitzer
Ken headshot

Kenneth Spitzer, PhD is appointed Director and serves until 2019.

2002 Dr. Tristani Identifies Several Novel Potassium Channel Mutations
Two ECG tracings labeled a and b. Tracing a shows a regular rhythm, while tracing b displays an irregular, erratic pattern with varying distances between peaks.

Dr. Tristani identifies several novel potassium channel mutations that provide new insight concerning the mechanism of cardiac arrhythmia in patients with Anderson syndrome. Tristani-Firouzi M, Jensen JL, Donaldson MR, Sansone…
Read More

2000 ECG Imaging of Electrophysiologically Abnormal Substrates in Infarcted Hearts
Two grids compare heart activity in control and infarcted tissues at 30ms and 200ms. Each grid shows torso, measured, and reconstructed maps, with color gradients representing electrical potentials over time.

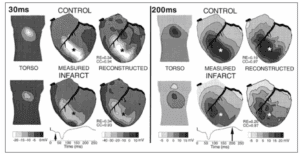
Drs. MacLeod and Taccardi strengthen the validity of using electrocardiographic imaging to detect and localize areas of myocardial infarct and structural disease. Burnes JE, Taccardi B, MacLeod RS, and Rudy…
Read More

1999 Co-Directors
A panoramic view of a city set against a backdrop of rugged, sunlit mountains under a blue sky, with buildings and greenery spread across the valley in the foreground.

Rob MacLeod, PhD, Kenneth Spitzer, PhD, and Bruno Taccardi, MD, PhD are appointed co-Directors.

1998 Human Platelets Translate Messenger RNAs
A set of scientific images: (a) and (b) show cell cultures with stained regions; (c) shows a blot with labeled bands for Bcl-3; (d) shows a time-course blot for Bcl-3 with fold increase values listed below each lane.

Drs. Elstad, McIntyre, Prescott, Weyrich, and Zimmerman demonstrate that activated human platelets translate messenger RNAs, which are basally present in an extensive and diverse endogenous transcriptome, to critical biologically-active proteins,…
Read More

1995 LQT
Screenshot of a research article titled A Mechanistic Link Between an Inherited and an Acquired Cardiac Arrhythmia: HERG Encodes the IKr Potassium Channel with the abstract text partially visible below.

Sanguinetti and Keating publish a mechanistic cause for long QT syndrome (LQT).

1994 Director Lux
BobLux headshot

Robert L. Lux, PhD is appointed Director and serves until 1999.

1990 Relationship Between Charge Movements Associated With ICa and INa-Ca in Cardiac Myocytes
Two headshot portraits labeled 1990. The left image shows a man with gray hair wearing a dark shirt, labeled John Bridge. The right image shows a man in glasses and a suit, labeled Ken Spitzer.

Drs. Bridge and Spitzer show the close connection between calcium influx via calcium current and efflux via sodium-calcium exchange in heart cells. Bridge JH, Smolley JR, Spitzer KW. The relationship…
Read More

1991 Epicardial Mapping
Diagram showing two heart cross-sections with color-coded activation isochrones, labeled Measured and Reconstructed, for two cycles. Arrows and ECG graphs illustrate electrical wave propagation and timing in milliseconds.

Taccardi and Lux publish a structural model of epicardial mapping from the body surface.

1989 First Plasma Lipid
Three line graphs show PAF acetylhydrolase levels across fractions for abetalipoproteinemia (A, one peak left), normal (B, two peaks labeled HDL and LDL), and Tangier disease (C, one peak center). Y-axis: enzyme activity; X-axis: fraction number.

Drs. McIntyre, Prescott, Stafforini, and Zimmerman first demonstrate that the plasma lipid environment significantly modulates PAF hydrolase activity provided the basis for further research concerning lipid signaling and inflammatory regulation.…
Read More

1985 Inflammatory Cell-Cell Interactions
Black and white microscopic image showing several round, textured cells clustered together against a darker background. A letter C appears in the top right corner.

Drs. McIntyre, Prescott, and Zimmerman demonstrate that thrombin promotes neutrophil-endothelial interaction provided the basis for further research regarding inflammatory cell-cell interactions. Zimmerman GA, McIntyre TM, Prescott SM. Thrombin stimulates the…
Read More

1984 Human Endothelial Cells
Line graph showing [acetyl-3H]PAF production (dpm x 10^2) over 30 minutes. Production peaks at 10 min (~45), then declines steadily, reaching near zero at 30 min.

Drs. McIntyre, Prescott, and Zimmerman demonstrate that human endothelial cells rapidly express adhesion molecules for leukocytes when activated by prothrombotic or proinflammatory agonists. Prescott SM, Zimmerman GA, McIntyre TM. Human…
Read More

1982 William Devries
A doctor in a white coat smiles and speaks with a patient lying in a hospital bed, who is connected to medical monitors and appears to be recovering.

Dr. William Devries implants the Jarvik-7 heart into Dr. Barney Clark at the University of Utah.

1978 An Experimental Study in Dogs
Two panels labeled A and B show sequences of three rising curves with vertical dashed lines, and corresponding waveforms below them. Panel As wave is positive (α = +1), Bs is negative (α = -1).

Drs. Abildskov, Burgess, and Lux demonstrate the conditions of increased local disparity of ventricular recovery which increase vulnerability to arrhythmia can be detected by analysis of the body surface electrocardiogram.…
Read More

1976 Detecting Ventricular in Humans
Four contour maps labeled A, B, C, and D display electrical activity with overlaid vector arrows and contour lines. Each map shows patterns of activity and intensity; scale bars at the bottom indicate 100 μV or 50 μV.

Drs. Abildskov, Burgess, Lux, and Vincent study he utility of body surface electrical mapping in detecting ventricular recovery properties in humans. Abildskov JA, Burgess MJ, Lux RL, Wyatt R, Vincent…
Read More

1973 – Director Abildskov
ABILDSKOV Junior headshot

JA Abildskov, MD is appointed Director and serves until 1994.

1969 – CVRTI Building
A brick building with many windows is surrounded by green grass and trees. A sign in front reads “Nora Eccles Harrison Cardiovascular Research & Training Institute.”.

The Utah Board of Regents formally establishes the Nora Eccles Harrison Cardiovascular Research and Training Institute (CVRTI) at the University.

1967 – First Director
A man wearing glasses, a white coat, and a bow tie stands in front of bookshelves filled with books.

Maxwell M. Wintrobe, MD, then Chair of the Department of Internal Medicine, serves as the Planning Coordinator of CVRTI and later as the first Director (1969).